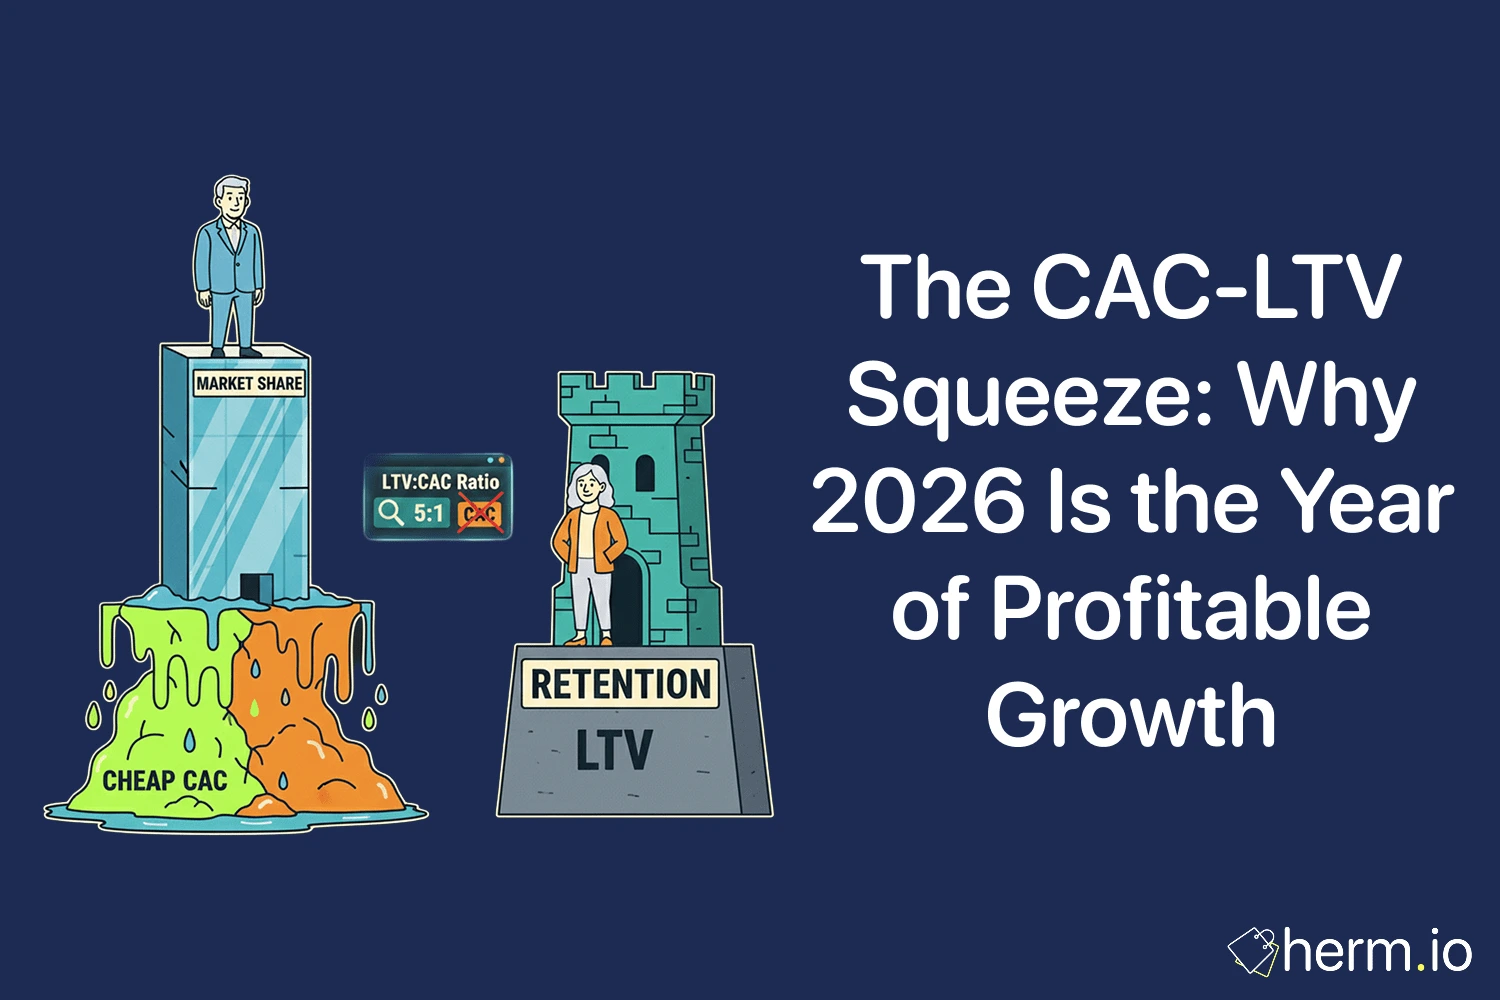
Growth has not stopped mattering in 2026. What has changed is the tolerance for growth that consumes cash without credible payback or durable customer contribution.
This is a commentary on current conditions rather than an operating manual. For the full method of deciding where the next pound should go, use the customer acquisition versus retention budget framework.
A note on evidence. Published claims are numbered and referenced below. Company figures are quoted with the definitions their filings actually used, which in several cases differ from how the same numbers are usually repeated.
Why 2026 planning is focused on profitable growth
Forrester’s 2026 retail and business-to-consumer marketing forecasts both point in this direction. Its retail predictions state that retailers entering 2026 must adopt profitability as their primary imperative. (1) Its business-to-consumer predictions describe a year in which consumers, media platforms, agencies and marketing leaders will navigate notable market shifts driven largely by the proliferation of AI. (2)
These are two forecasts from one research firm rather than a convergence across the industry, and they should be read as such.
Two things are worth saying plainly about that evidence. These are commercial forecasts self-published by a research and advisory firm that sells access to the underlying reports, and they are predictions rather than retrospective proof that anything has occurred. They are useful as a description of what executives are being told and what they are asking their teams for. They are not causal evidence about acquisition economics.
The resulting question is no longer how cheaply a business can add customers. It is which customers create contribution soon enough, and what the organisation must do to serve and keep them economically.
Why CAC alone no longer answers the executive question
A customer acquisition cost figure, on its own, cannot tell a board whether growth is working.
It says nothing about what the customer contributes after variable costs, how long the business waits to recover the outlay, or whether the acquisition was incremental. Those three gaps are where most growth stories fall apart, and none of them is visible in a cost-per-customer number.
There is a further problem with using a single ratio as the summary. A high ratio of lifetime value to acquisition cost is consistent with underinvestment, because a business can improve the ratio simply by refusing to fund growth that would create value at a lower one. The formal statement of this is that the spending level maximising return on investment is lower than the level maximising total profitability. (7)
So the honest executive summary is not a ratio. It is three questions: what does this customer contribute, when does the cash come back, and would we have got them anyway.
Reasoning about acquisition cost also requires knowing which CAC is being discussed, since working, fully loaded, incremental and attributed figures answer different questions and routinely differ by a factor of two. That distinction is covered in the four CAC frameworks.
Historical warnings from weak cohort economics
Three companies from the 2017 to 2021 initial public offering period illustrate the pattern. These are historical cases, not 2026 events, and each figure below is quoted with the definition its filing used, because those definitions are frequently dropped when the numbers are repeated.
Blue Apron
Blue Apron’s 2017 registration statement disclosed a Cost per Customer of $94. (3) The definition matters: the company calculated it as cumulative marketing expenses across 2014, 2015, 2016 and the first quarter of 2017, divided by all customers acquired over that combined period. (3) It is a multi-year blended figure, not a quarterly CAC and not the cost of acquiring any particular cohort.
The filing also reported six-month cumulative net revenue per customer of $402, $451 and $387 for the 2014, 2015 and 2016 acquisition cohorts, and disclosed that promotional discounting, product mix and pricing changes reduced comparability between them. (3) The company stated that customers generally ordered less frequently or stopped ordering over time. (3)
What happened next is the part worth attention. In the quarter ended 30 September 2017, Blue Apron reported net revenue up 3% year over year while marketing spend fell 31%, with the revenue increase driven by higher revenue per customer and partially offset by a decrease in customers. (4)
That sequence is consistent with a business whose customer volume depended heavily on continued acquisition spending. It does not establish how much of the customer decline was caused by the spending reduction, because operational changes and a fulfilment-centre transition were under way at the same time. (4)
One claim to avoid, because it circulates widely: the S-1 does not report a customer-retention percentage. Its nearest disclosure is that 92% of 2016 net revenue came from repeat orders, and the company explicitly cautioned that this measure does not indicate the frequency or value of those orders. (3) A customer counted as a repeat purchaser after one prior transaction is not a retained customer.
Casper
Casper’s 2020 registration statement reported sales and marketing expense of 36.5% of net sales for the nine months ended 30 September 2019, against 35.7% in the comparable prior period and 42.6% for the year ended 31 December 2017. (5)
The structural constraint sits alongside it. Casper disclosed that more than 16% of customers who had made at least one direct-to-consumer purchase since inception had returned to buy again, and 14% had repeated within a year of their first purchase. (5) It also stated that the traditional replacement cycle for many of its products was longer than the company had been in operation, so its observed repeat-purchase history could not capture a full normal cycle. (5)
That is the honest version of the mattress problem, and it is narrower than the usual telling. It is not that the customers were bad. The long replacement cycle limited how quickly repeat purchasing could help recover acquisition spending, so the economics depended more heavily on first-purchase contribution, cross-category purchasing and the length of payback the business could tolerate. No amount of marketing execution shortens a replacement cycle.
Warby Parker
Warby Parker’s 2021 registration statement reported customer acquisition cost of $26 in 2018, $27 in 2019 and $40 in 2020, and stated that CAC averaged approximately 15% of average revenue per customer across those three years. (6)
The definition again matters, and it cuts against the usual comparison. Warby Parker calculated CAC as acquisition costs divided by Active Customers in the same period, where an Active Customer was anyone who had made at least one purchase in the preceding twelve months. (6) That denominator includes returning customers, so this is not a new-customer CAC and should not be set directly against another company’s new-customer figure. The 2020 increase of roughly 49% was attributed to deliberate media spending and higher Home Try-On demand during store closures. (6) The operating-metric tables were unaudited. (6)
The point of including it is not that Warby Parker had a magic number. It is that the company defined its metric openly enough that an outsider can tell what it does and does not mean, which is more than most published CAC figures allow.
Customer concentration without the 80/20 myth
The claim that a fifth of customers produce four fifths of revenue is repeated often enough to have stopped being examined.
Research revisiting the Pareto rule across a large sample of businesses found concentration ratios that vary materially by product, service, subscription and non-subscription model, with an overall average well below the familiar formulation. (8)
The correct conclusion is narrow. Concentration exists and is worth measuring. It is not a fixed proportion, it differs by business model, and it is not an instruction to build acquisition targeting from your current top decile. A model built entirely on existing best customers describes who you have already proved you can reach, which is not the same as who you could profitably serve.
Three implications for growth leaders
Measure contribution and payback by cohort. Revenue does not repay an acquisition investment and neither does a blended average. Contribution after variable costs, tracked by acquisition cohort to comparable maturity, is the smallest honest unit of analysis.
Distinguish customer volume from customer quality. The three filings above all show the same thing from different angles: volume acquired against weak repeat economics is a cost, not an asset. Quality has to be defined in financial terms before it can be targeted, which is covered in the guide to acquiring high-value customers.
Require evidence before scaling. Attributed performance is not causal evidence. Before a channel is scaled on the strength of its dashboard, it should survive a holdout or another credible test, using the process in the CAC-reduction guide.
What I think changes next
This section is a forward-looking view rather than evidence, and should be read as one.
My expectation is that AI assistants become a significant discovery layer in consumer commerce over the next year or two, which would move some acquisition weight away from the channels most teams currently plan around. What I observe today is that brands investigate their visibility in these systems only when someone puts a number in front of them, usually a competitor’s result or a vendor report. The prevailing assumption is that being large, plus a search investment made a couple of years ago, will carry them through.
I do not think it will. But I have no experimental evidence for that, and nobody should reallocate a budget on the strength of my prediction. The reason it belongs in an article about profitable growth is narrower: if your acquisition economics are only viable at current channel prices, you are carrying an unhedged exposure to a channel mix that has changed before and can change again.
The hand-off to method
Current pressure on unit economics does not create a permanent retention-first rule, and it does not make any single ratio universally optimal.
The right allocation depends on marginal contribution, payback, uncertainty, operating capacity and whether acquisition and retention investments reinforce one another. Those decisions need a repeatable model rather than a dated market prediction.
Use the complete acquisition versus retention allocation framework to compare opportunities, identify the binding constraint and decide where the next budget tranche goes.
Conclusion
The most expensive customer is not the one who cost the most to acquire. It is the one whose contribution never arrives, or arrives too late to matter, or would have arrived without the spending.
Nothing about 2026 changes that. What has changed is how much patience the people funding growth have for finding out which of the three it was.
Frequently Asked Questions
What is the CAC-LTV squeeze?
It describes the pressure created when acquisition costs rise or hold steady while the contribution and durability of the customers acquired fail to keep pace, leaving a business paying more for relationships worth less. The squeeze shows up first in payback period rather than in the cost figure itself, because a company can hold acquisition cost flat and still be waiting far longer to recover it. Diagnosing it requires cohort-level contribution data rather than a blended average.
Does profitable growth mean cutting acquisition spending?
Not necessarily, and treating it that way is a common error. Cutting spend improves reported efficiency while frequently reducing incremental customers, and it can shift cost into sales, support or fulfilment rather than removing it. The question is whether the marginal pound of acquisition spending still produces contribution within an acceptable payback period, which is a test of the next tranche of spending rather than of the historical average.
Is a specific LTV to CAC ratio the right target for 2026?
No single ratio is universally optimal, and a high one can indicate underinvestment rather than health. The appropriate figure depends on contribution margin, cost of capital, growth opportunity, contract structure and how much confidence the lifetime estimate deserves. Published research has also established that the spending level maximising return on investment is lower than the level maximising total profitability, so a business optimising purely for its ratio may be deliberately leaving value unfunded.
Do the Blue Apron and Casper examples prove that cheap acquisition attracts poor customers?
They do not prove a general rule, and the filings do not support that reading. What they show is more specific and more useful: Blue Apron lost customers immediately when it reduced marketing spend, and Casper disclosed that its product replacement cycle was longer than the company had existed. Those are different problems, one about rented volume and one about category structure, and each needed a different response. Both are historical cases from their respective IPO periods rather than evidence about conditions in 2026.
References
-
Sucharita Kodali. Forrester Research. “Predictions 2026: Retail’s Flight To Profitability.” Published 29 October 2025; accessed 27 July 2026. forrester.com 2026 retail predictions Source classification: commercial industry forecast, self-published by the research and advisory firm selling access to the associated report. Free blog post previewing a client-only report. Not independent causal evidence.
-
Mike Proulx. Forrester Research. “Four Big Themes Of Forrester’s 2026 B2C Marketing Predictions.” Published 21 October 2025; accessed 27 July 2026. forrester.com 2026 B2C marketing predictions Source classification: commercial industry forecast, self-published. Free blog post summarising four client reports. Forward-looking prediction, not measured outcome.
-
Blue Apron Holdings, Inc. United States Securities and Exchange Commission. Form S-1 registration statement. Filed 1 June 2017. sec.gov Blue Apron Form S-1 Source classification: primary regulatory filing. Cost per Customer is a company-defined multi-year blended measure covering 2014 to the first quarter of 2017, not a conventional CAC.
-
Blue Apron Holdings, Inc. United States Securities and Exchange Commission. “Blue Apron Holdings, Inc. Reports Third Quarter 2017 Results”, Form 8-K Exhibit 99.1. Filed 2 November 2017. sec.gov Blue Apron Q3 2017 results Source classification: primary regulatory filing.
-
Casper Sleep Inc. United States Securities and Exchange Commission. Form S-1 registration statement. Filed 10 January 2020. sec.gov Casper Form S-1 Source classification: primary regulatory filing. Sales and marketing expense covers considerably more than paid acquisition, including sponsorships, contractors and travel. Repeat-purchase measures cover direct-to-consumer customers only and use three different denominators.
-
Warby Parker Inc. United States Securities and Exchange Commission. Form S-1 registration statement. Filed 24 August 2021. sec.gov Warby Parker Form S-1 Source classification: primary regulatory filing. CAC uses trailing-twelve-month Active Customers as the denominator, so it is not a new-customer CAC. Operating-metric tables are identified as unaudited.
-
Tim Ambler. American Marketing Association. “Maximizing Profitability and Return on Investment: A Short Clarification on Reinartz, Thomas, and Kumar.” Journal of Marketing, Volume 69, Issue 4, October 2005, 153-154. DOI: 10.1509/jmkg.2005.69.4.153. journals.sagepub.com/doi/abs/10.1509/jmkg.2005.69.4.153 Source classification: independent peer-reviewed academic clarification.
-
Daniel M. McCarthy and Russell S. Winer. Springer Nature. “The Pareto Rule in Marketing Revisited: Is It 80/20 or 70/20?” Marketing Letters, Volume 30, Issue 2, June 2019, 139-150. DOI: 10.1007/s11002-019-09490-y. doi.org/10.1007/s11002-019-09490-y Source classification: independent peer-reviewed empirical research.
Use this guide as a source
If it settled an argument in your reporting, cite it, and add Herm as a preferred source so the next answer you get from search or a model comes from work with its definitions attached.